Installation Manual
Prepare MetaTrader 4
- Download and Install Meta Trader 4 from your selected broker.
(If you haven't created an Account, check our Recommended Brokers) - Open the Meta Trader 4
- To the right is the usual default view or “Profile” for a new MT4 (Meta Trader 4) account.
- Essentially you will need 4 charts/chart windows to get started. As shown in the image.
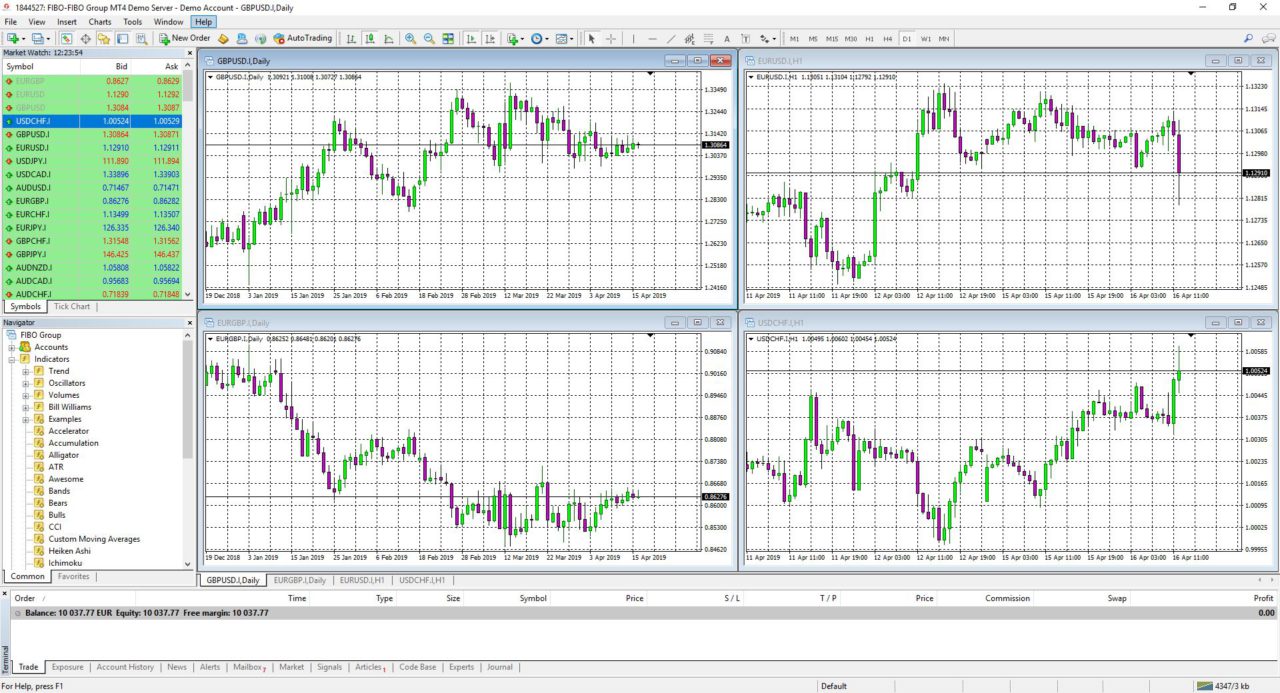
Default View of MT4 freshly installed
Download Swap Hunter
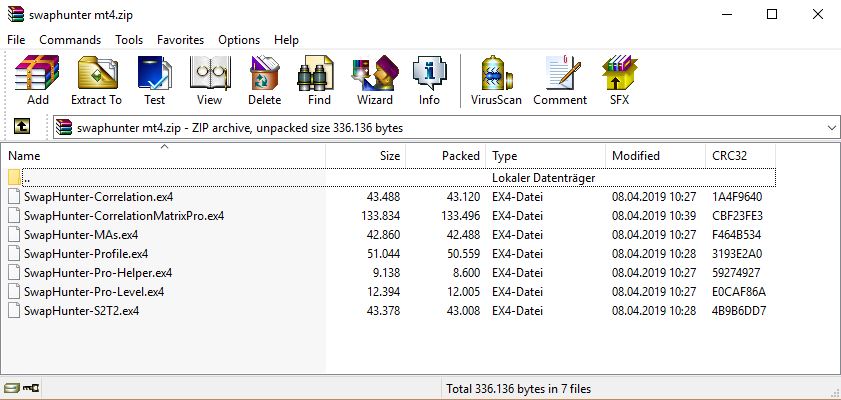
Swap Hunter EX4 Files
- Download our Swap Hunter. Once you have selected your licence package and provided us with ONLY your trading account number (NO PASSWORDS REQUIRED) and which broker you are using, we can then activate your licence in order to be installed and used on your trading account.
- Open/Unzip the folder this will show you the indicators/ex.4 files included in the package.
- Go Back in to MT4...
Install Swap Hunter
- Under "Tools / Options", open “Options”.
- Select the "Expert Advisors" tab and mark the entry "Allow DLL imports" and confirm by clicking “OK”
- In the "File" menu select "Open Data Folder".
- Select the subfolder "MQL4", then the subfolder "Indicators" and copy and paste all of the *.ex4 files from the zip
file into the “Indicators” folder. - Close MetaTrader4 and reopen it.
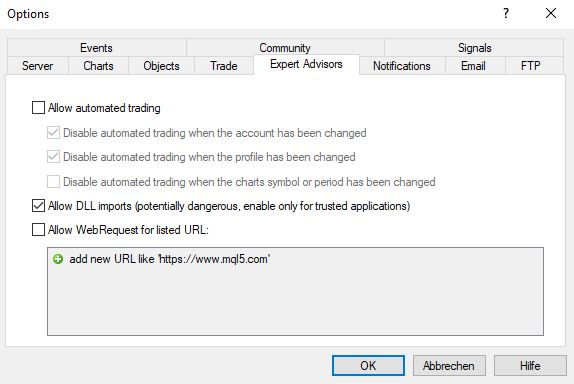
Enable DLL downloads in MT4 Options
Delete Default Indicators
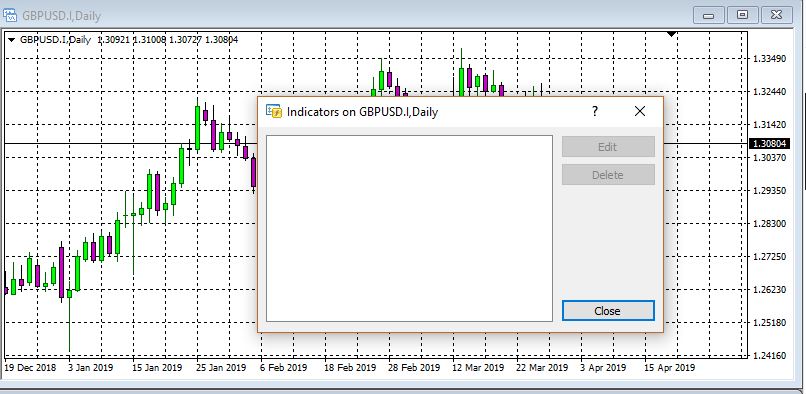
- In the “Navigator” window, the indicators can now be found by expanding "Indicators" sub menu.
- Right-Click on chart in top left hand corner and select “Indicators List”.
- Then select and delete all indicators.
Do the same on all 4 charts so there are no indicators on the charts.
You can add more indicators after the installation if you like.
Activate Swap Hunter Indicators
-
- Drag and Drop the "Correlation Matrix Pro" on to the chart in the top left corner. You will see a window pop-up when you drop the "Correlation Matrix Pro" on the chart. Click “OK”.
- Drag and Drop the FTC Correlation indicator on the chart in bottom left corner (again the Indicator Properties window will pop up) click “OK”. Chart in Top left hand corner should now look like this (image right).
- Drag and Drop the FTC Pro Helper, first on to the chart in top right hand corner, now again the Indicator Properties window will pop up. You must double-click “Helper for” in the “Inputs” tab and then select “Correlation Matrix Pro Chart 1”.
You can now put the FTC- MA’s indicator (assorted industry standard Moving averages) on both charts on the right hand side. Again the Indicators Properties window will pop up, click “OK”. - Do the same for the FTC Pro Level indicator on both charts on the right (this indicator gives you suitable entry and exit levels to open/close your trades. The parameters can be adjusted by right-clicking on the chart and going into Indicators List and double-clicking FTC Pro Level. When you add these additional indicators your charts on the right will look like this.
- You can adjust the Take Profit and Stop Loss levels by %.
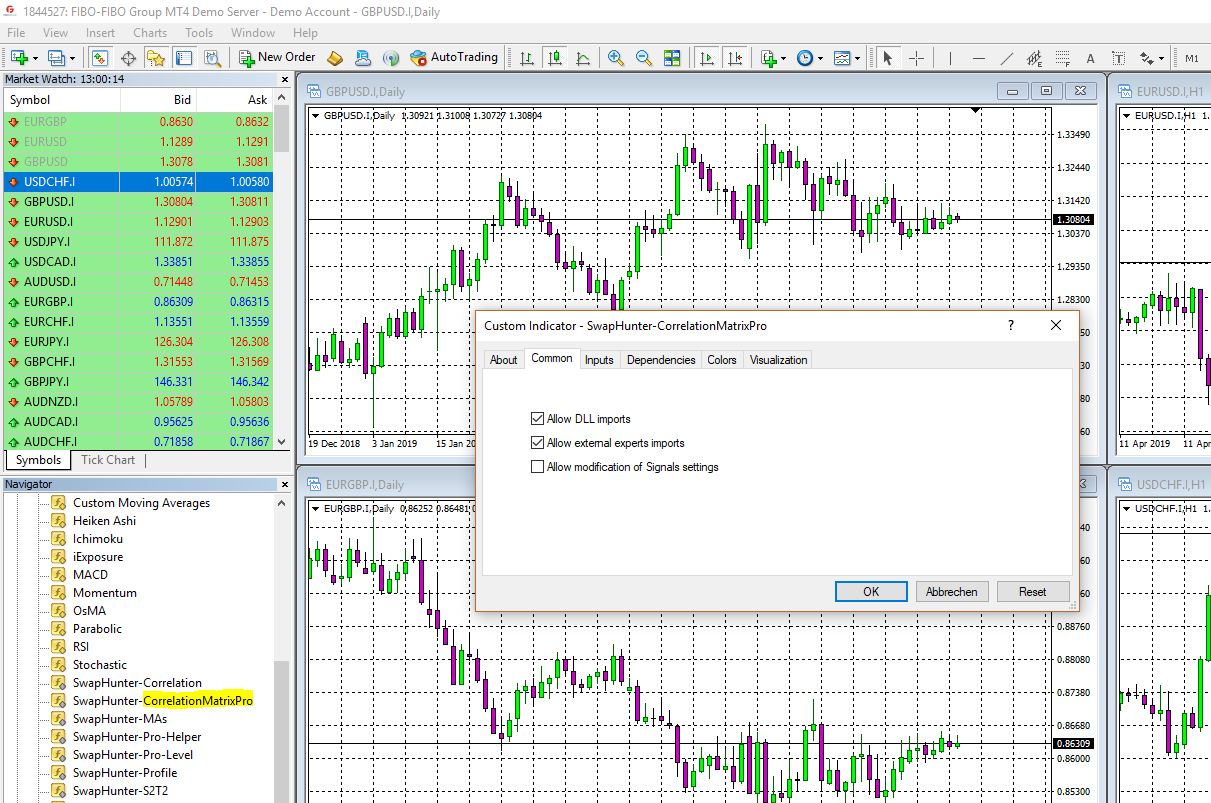
Drag & Drop the Correlation Matrix Pro & Correlation on a Chart
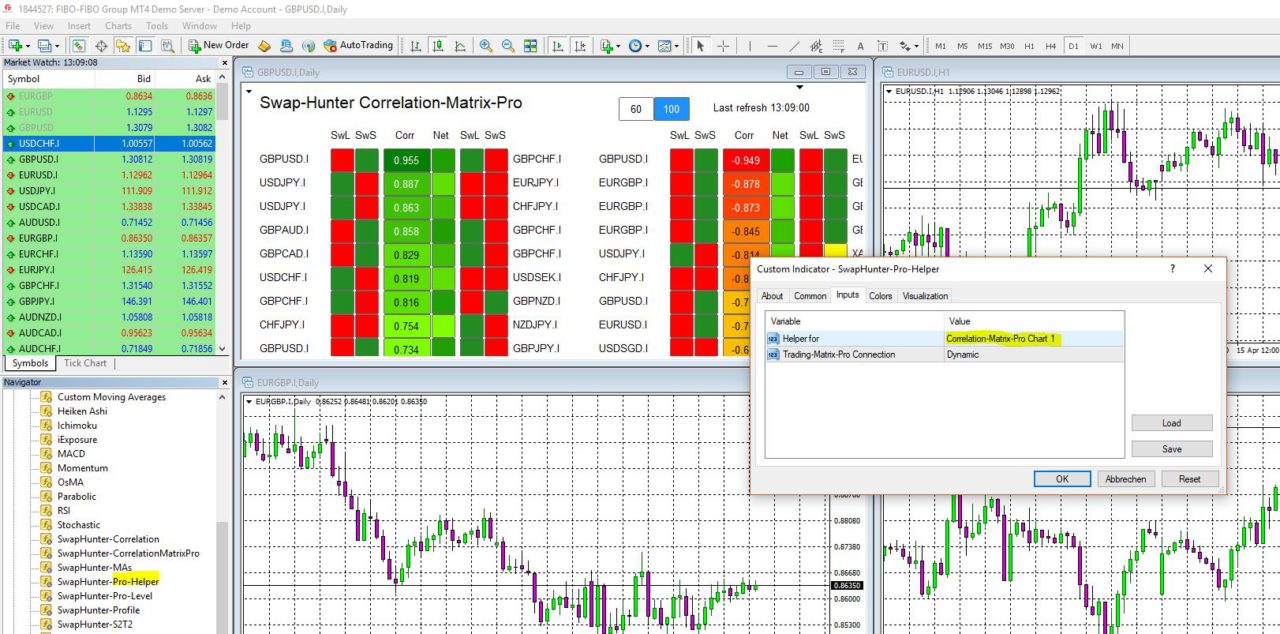
Select the Chart accordingly for the Helper
Customize your MT4 Profile
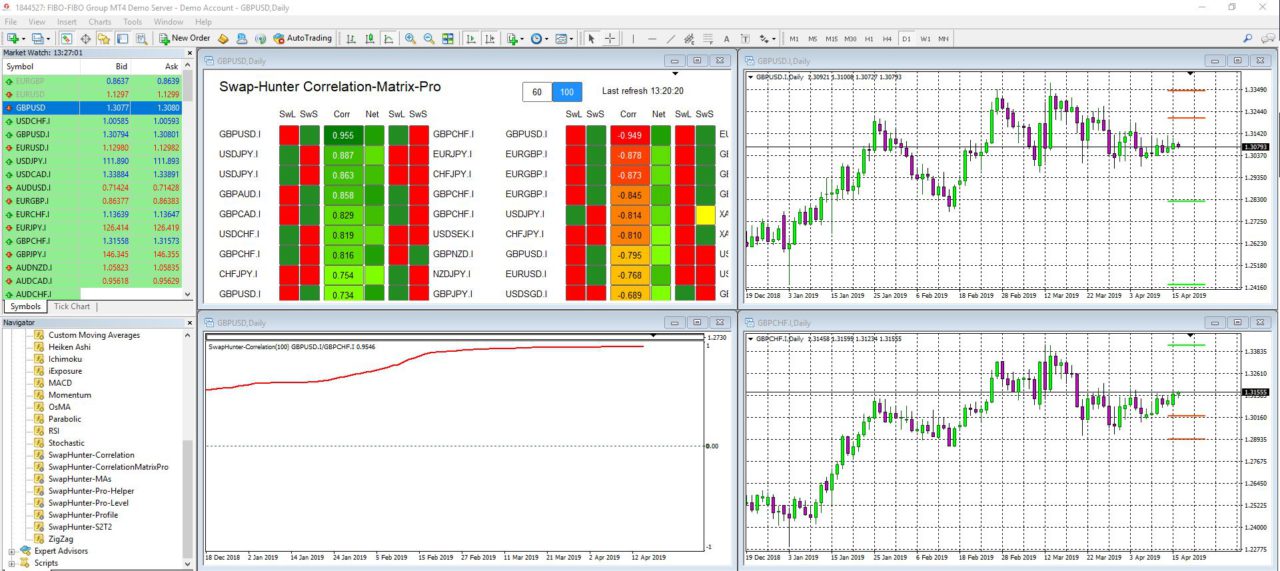
Now it is time to adapt the Profile
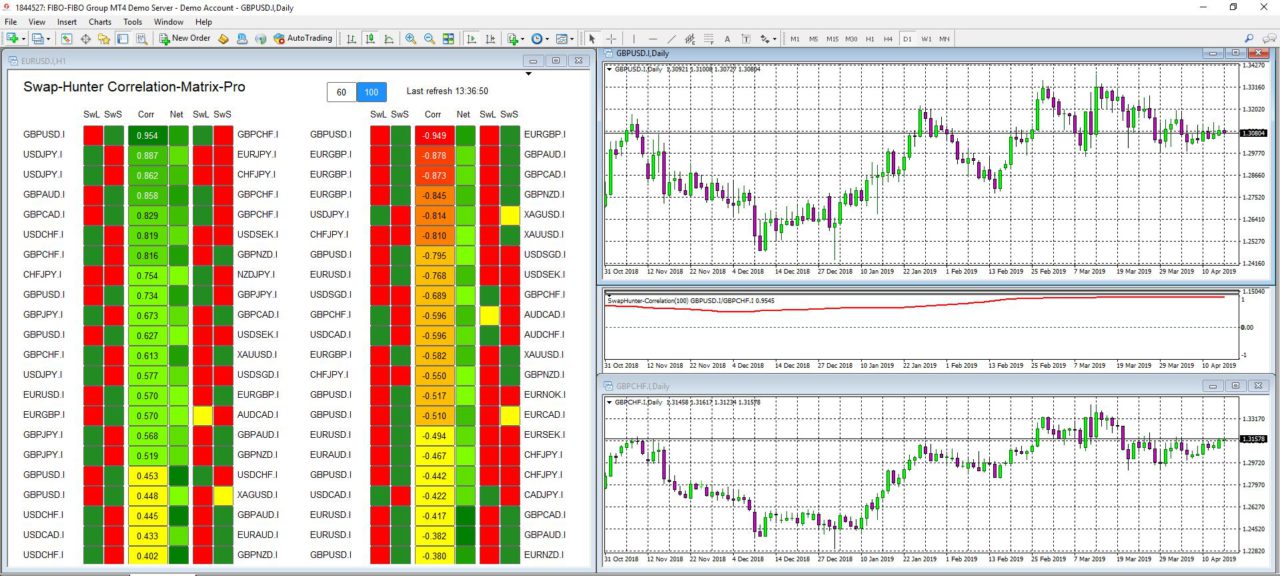
We recommend this arrangement in MT4
-
- At this Stage your MT4 will be looking similar to this. All Charts should be connected to the Correlation Matrix Pro. You can test it by clicking on one ofe the Correlations in the Matrix
- You could already start using it, but we recommend a few adaptions to the default view.
- Remove the Market Watch and Navigator Windows on the left hand side, we dont need them at this Point.
- Arrange the remaining 4 Windows to non overlapping Tiles (Klick on the 4 Window Icon in the Bar, or press Alt+R).
- Move the Correlation Indicator between the 2 Asste Pair Charts on the right and arrange it beween them, taking a minimum Space, leaving 60-75%the height for the Charts
- Enlarge the Correlation Matrix Pro to maximum on the Left side.
- Save the Profile under a name you will easily remember, such as "Swap Hunter"
Get your Edge over the Market
Using the Swap Hunter Indicators
-
- It is a good idea at this stage to right-click on both charts on the right and select “One Click Trading” in order to execute trades quickly and easily. Every second and every pip counts! So try to place the trades as quickly as you can but DO NOT rush. Make sure you are correctly buying or selling each asset pair in order to be properly hedged and to protect your equity. Also to accumulate the NET Swap differentials correctly
- So you can now select a correlated pair of assets and they should appear in both windows on the right hand side and change when you select a different correlated pair of assets. To select a pair of assets you click on the middle column labelled Corr. in the Swap Hunter Correlation Matrix Pro chart/window. This column displays the strength of the correlation of the two asset pairs represented by a figure between +1 and -1.
- The Swap Hunter Correlation indicator in the chart in the bottom left hand corner will also display a graphical representation of the strength of the correlation. The closer it is to +1 means a strong positive correlation and closer to -1 will mean a strong negative correlation.
As you can see in this image above you can close the Market Watch window and the Navigator window to maximize all charts within MT4 platform.Drag the border of Swap Hunter Correlation chart (bottom left corner) to the top so it takes up the whole chart window.
You can also see that USD/JPY and EUR/JPY have been selected in the Swap Hunter Correlation Matrix Pro as both charts on the right display these two asset pairs. The green box in the column labelled “Net” has been checked/ticked/selected so you can keep track of what you are trading.
This box also gives you the calculation of the Net Swap differential when your mouse is hovering over it.
- So in the Swap Hunter Correlation Matrix Pro, you have the positively correlated assets (left hand side) and negatively correlated assets (right hand side).
- You can command the Swap Hunter Correlation Matrix Pro to calculate the correlations between asset pairs over a 60 Day Period or over a 100 Day Period. It is recommended to have your charts on Daily timeframes.
- The SwL box (Swap Long/Swap Buy) this is the amount of Swap you will earn every night at 00:00 GMT (rollover period) from going long/buying this asset. Likewise you have the Sws box (Swap Short/Sell) box displaying the Swap you will earn at 00:00 GMT (rollover period) by going short/selling this asset. Then the Net box calculates the differential Net Swap you will earn every night from buying and selling these assets. As they have a positive correlation you need to buy and sell, or sell and buy the assets on the left hand side in order to be hedged. All the assets on the right hand side of the Swap Hunter Correlation Matrix Pro are negatively correlated meaning that you will have to buy one asset and buy the other or sell and sell the other asset in order to be hedged.
- The color coding gives you a very good idea of the strength of correlation and the amount of individual and Net Swap’s you will earn. Green and red being the strongest correlations and highest Net Swap differentials.
- Please remember we are always on hand to provide one-on-one tutorials. If you need any additional support installing, using or monitoring the trades you enter using this indicator just get in contact and we will make an appointment for you.
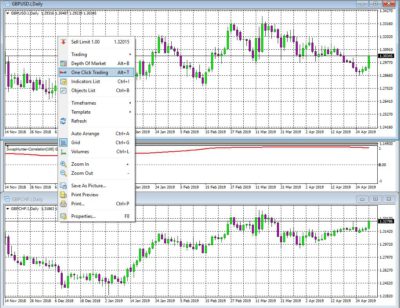
Activate One Click trading for a smoother trading experience
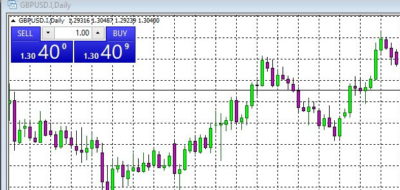
One-Click buy needs your approval before installing
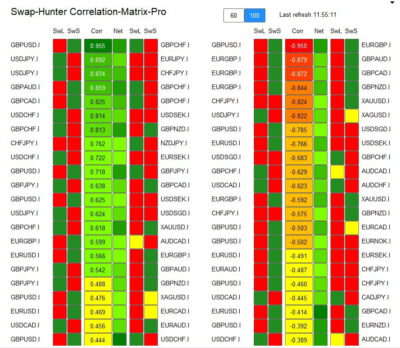
Swap Hunter Correlation Matrix Pro gives an overview of all Asset Pairs
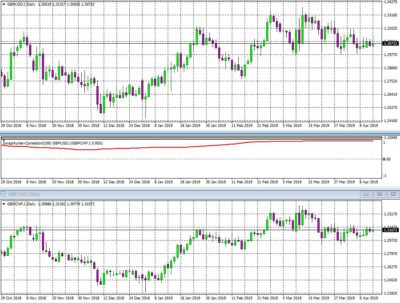
Swap Hunter Correlation: Graphical representation of the strength of the correlation
(Strong positive Correlation with 94.3%)
(Strong positive Correlation with 94.3%)
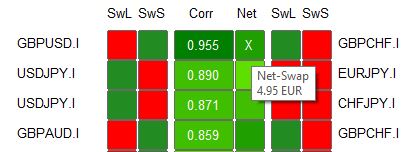
The net Swap for the correlated Pairs
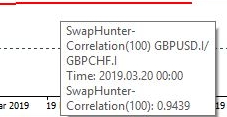
Correlation in Detail, 94,39% is a very strong Correlation
